The Gradebook is the one screen that answers “how is everybody doing?” It is a grid: learners down the side, every activity across the top, and a mark in each cell. Find it at InsightsGradebook.
Pick a course or a series
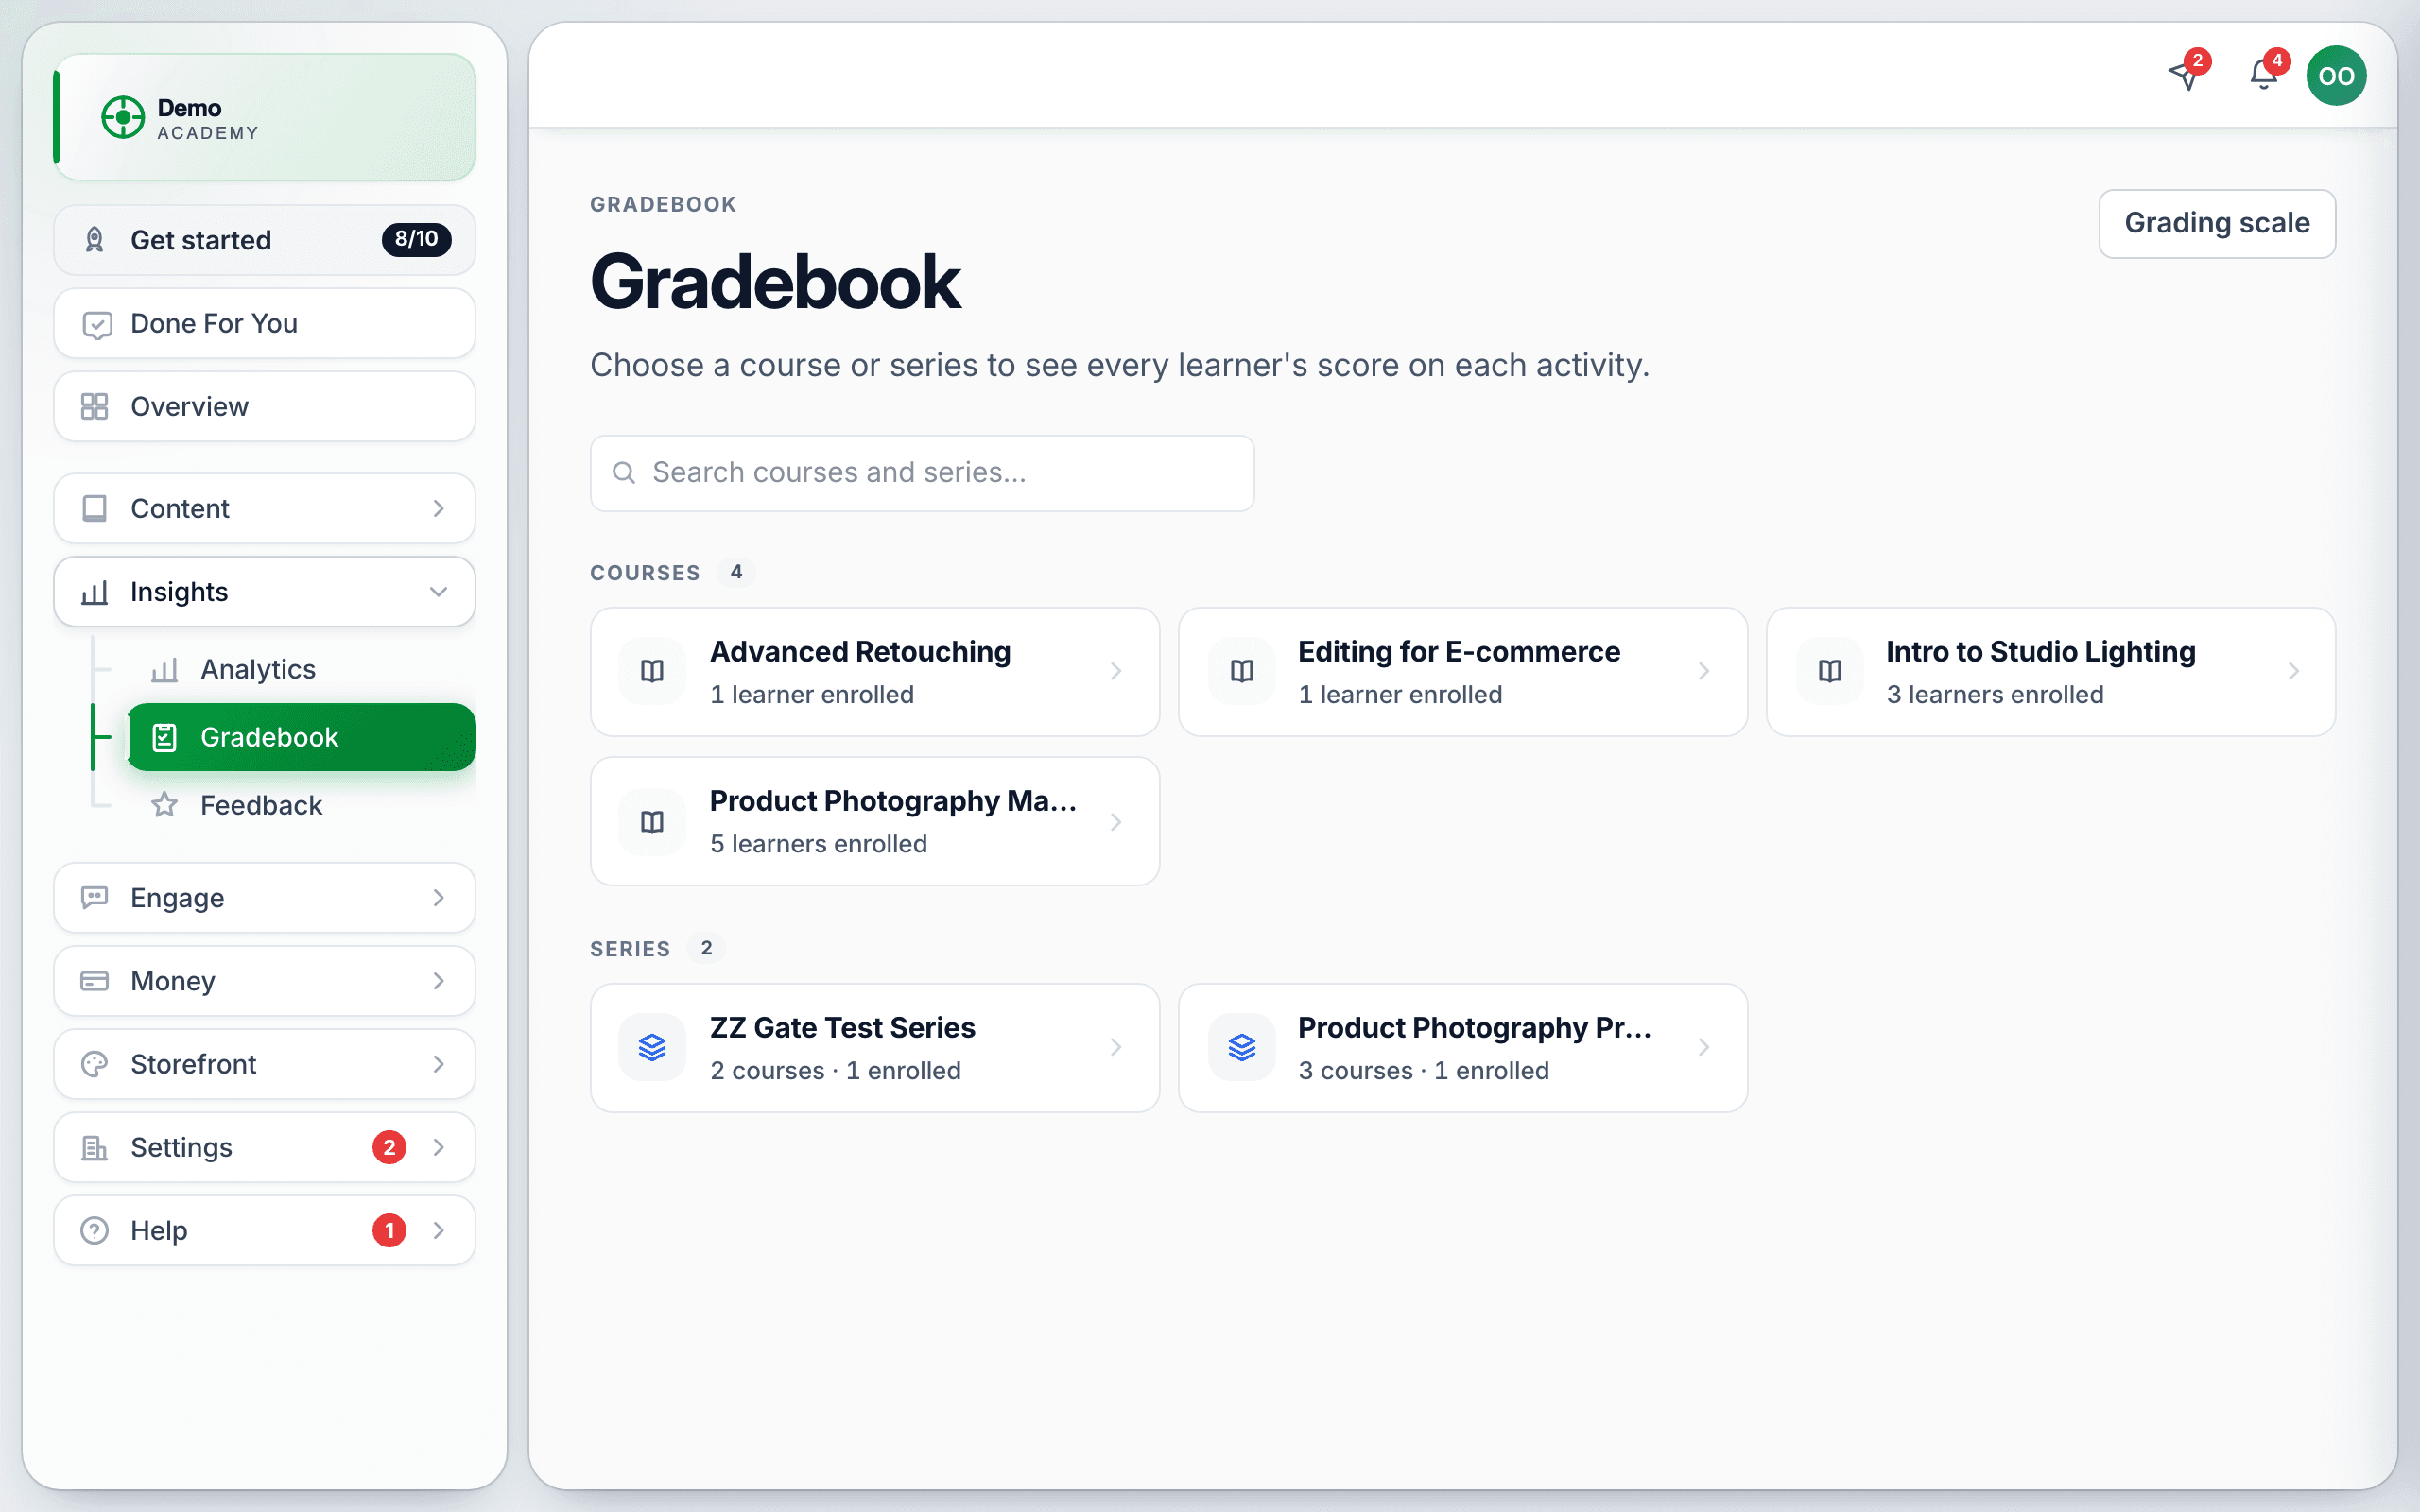
You land on a picker listing your Courses with how many learners are enrolled, and your Series with their course count. There is a search box when the list gets long. Pick one to open its scorecard.
Reading the grid
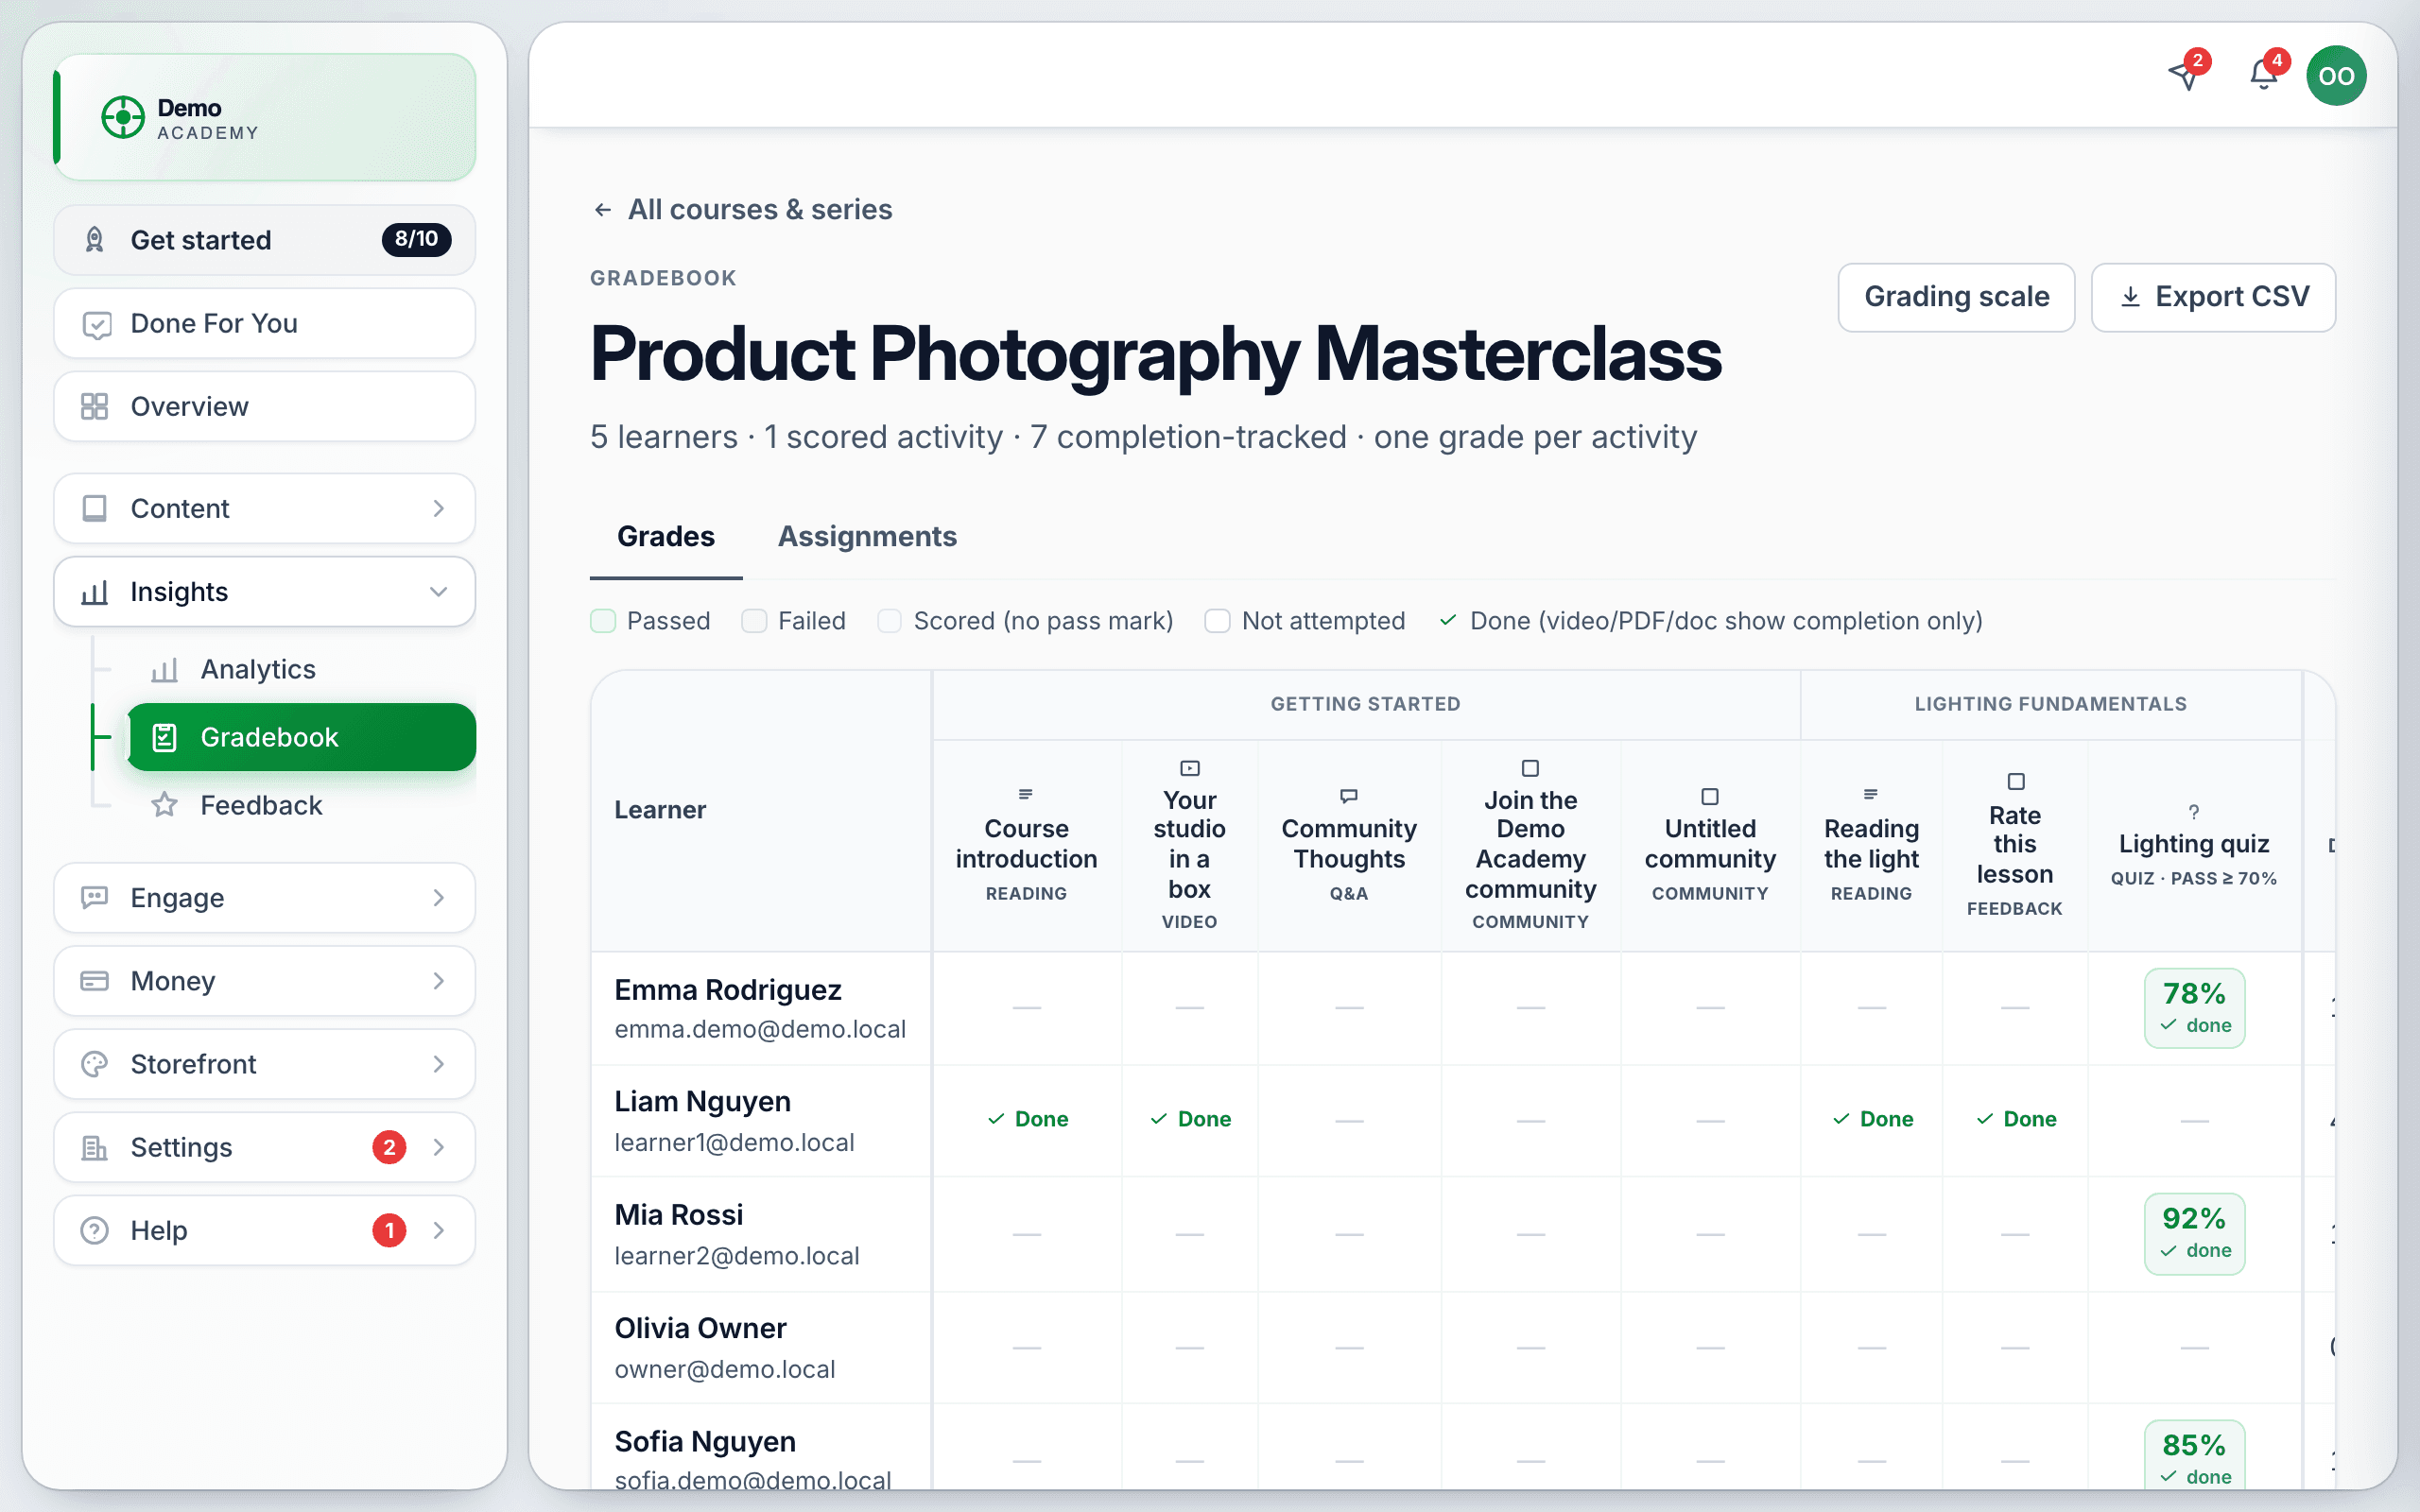
The header line under the course title tells you what you are looking at — for example 5 learners · 1 scored activity · 7 completion-tracked · one grade per activity. That distinction matters:
- Scored activities — quizzes, assignments and SCORM packages produce a percentage.
- Completion-tracked activities — videos, PDFs and documents can only be done or not done. They show Done, never a score.
The legend above the grid spells out every state:
- Passed (green) and Failed (red) — scored, against the pass mark.
- Scored (no pass mark) — a number, but you never set a threshold.
- Not attempted — shown as a dash.
- Done — a completion-tracked activity that is finished.
Columns are grouped under their lesson heading, and each column names the activity and its type, so a wide course still reads in order.
The Assignments tab
Next to Grades is Assignments, carrying an amber count of work waiting to be marked. Click a learner’s row to open the grading drawer, read what they sent, give a score or fill in the rubric, and save — or send it back with Request revision. The full process is in Assignments.
Your grading scale
Grading scale sets the letter bands that percentages roll into. Enter a minimum percentage for each letter, highest first. + Add band adds one, and Reset to A–F restores the default. Save scale applies it.
The scale belongs to your academy, not to one course, so changing it changes every letter grade everywhere. You need at least one band — saving with none gives you “Add at least one grade band.”
Export
Export CSV on the Grades tab gives you the whole grid as a spreadsheet — the right way to hand results to someone who does not have a Learn 360 login, or to keep a record before you change a course.
What learners see
Learners get their own results under My Grades in their menu — their own row and nobody else’s. They can open an assignment to read your written feedback and their rubric marks.
Two things that will puzzle you
- A percentage that does not match the “/ 100”. Changing an assignment’s max points or pass threshold after grading is not retroactive — old grades keep the percentage they were given.
- A learner the gradebook calls finished but the course calls incomplete. A learner who used up their quiz retakes without passing is settled here but still blocked there, which also blocks their certificate. See Every activity type explained.
For enrolment, progress and completion figures rather than marks, use Analytics.